| available with: |
| Windows Player : Premium web Player : Premium LG webOS Signage Player : Premium Samsung SMART Signage Platform (SSSP / Tizen) Player : Premium Brightsign Player: Premium Android Player: Premium Linux Player: Premium macOS Player: Premium |
In addition to allowing you to display the details of bus or train trips, it is also possible to use the GTFS data to create templates that contained passenger information.
Important: The GTFS feed you are using must provide this information for this type of template to function. Look into confirming the availability of these communications before creating a template.
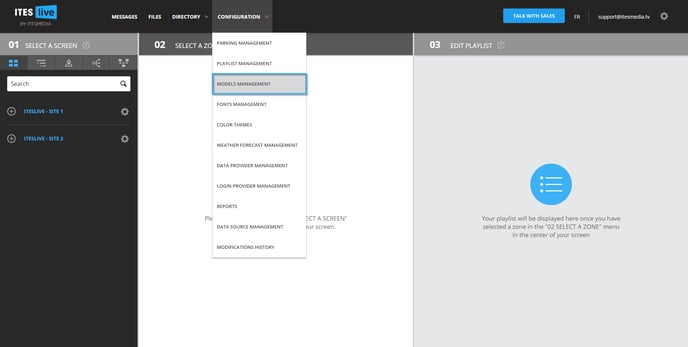
1. On the ITESLIVE Studio, click on the configurations tab and select "Models management"
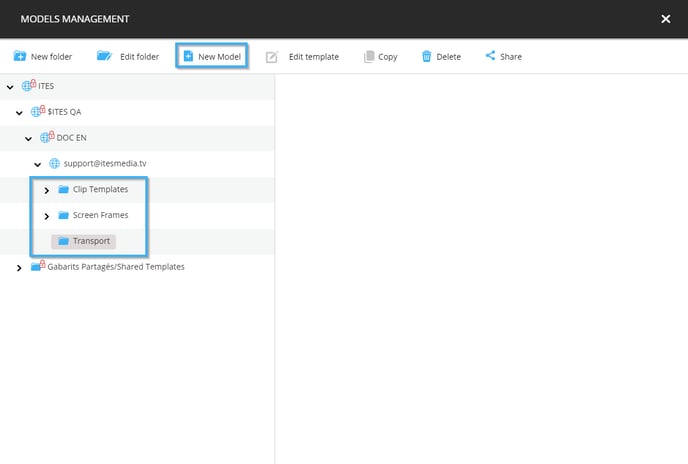
2. Navigate to the folder in which you would like to create the template and or create a new folder for your template and click the button named new model
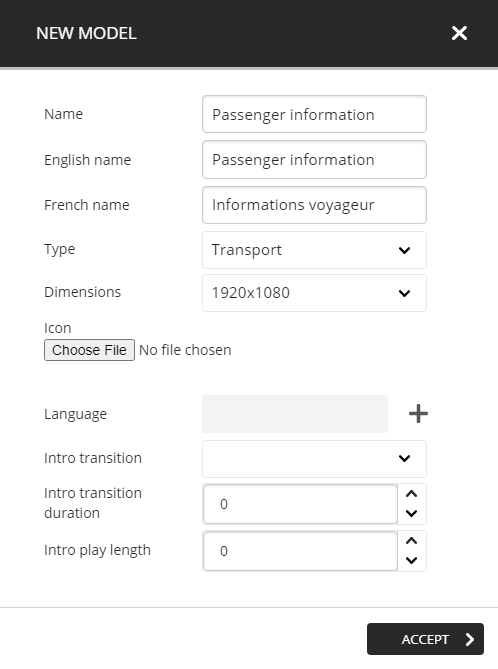
3. Determine the template's configurations
Before creating the visual aspects that will be used in the template, you must provide the following details.
- Name: Unique identifier for the template
- English name: The name that will be displayed for this template when the Studio is used in English
- French name: The name that will be displayed for this template when the Studio is used in French
- Type: In this case, we will be using the transport clip type
- Dimensions: The resolution of the template must be identical to the resolution of the zone in which you will be using it
- Icon: A file you can select that will be used as a "Thumbnail" for the template
- Language: Determines the languages that will be available in the template
- Intro transition (optional): The animation for the transition for the template if it has an introduction
- Intro transition duration (optional): The length in seconds for the transition of the intro
- Intro play length (optional): The total play length for the introduction
Once the required information has been entered, click the "accept" button.
4. Add a data source
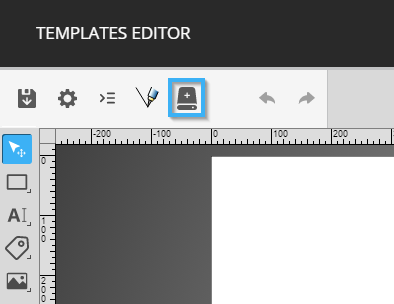
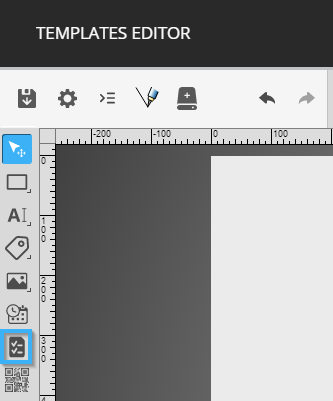
Once the configurations have been applied, the ITESLIVE Studio will automatically open the template editor. To configure the transit data in the template, you will first need to add a data source to the template.
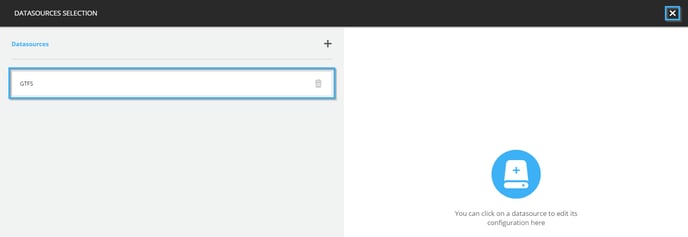
- Click on the icon that represents a hard drive
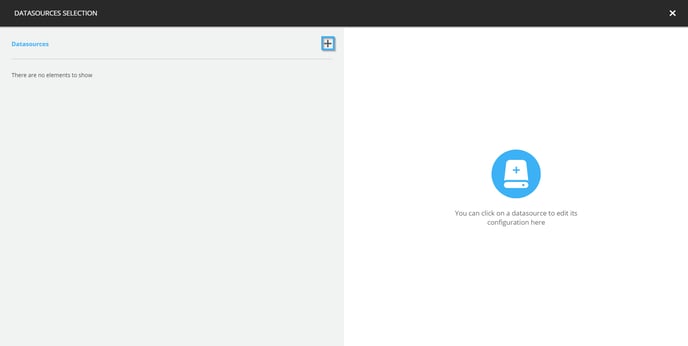
- Click on the "+" icon
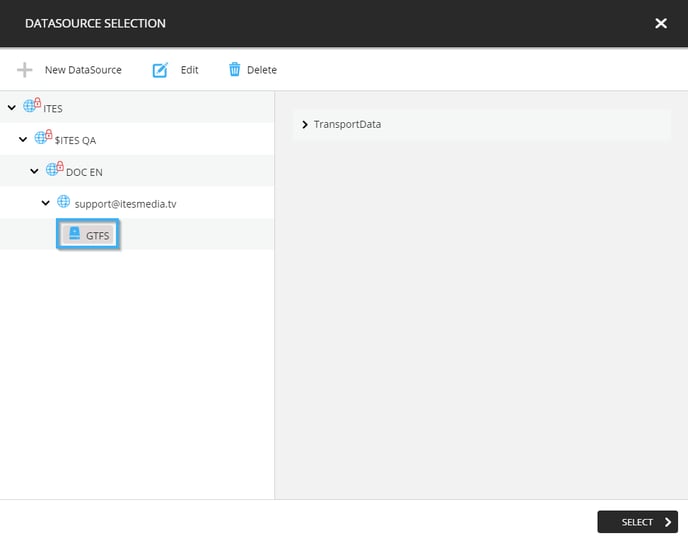
- Click on the data source desired and click on the "select" button
- In this example, you will need to make it so that all of the communications will be displayed in a single clip (one at a time). Thus, you will need to activate the "All" checkbox next to the "Items per slide" configuration. Then click on the arrow next to the "TransportData" entry and select "Messages" as the main data node.
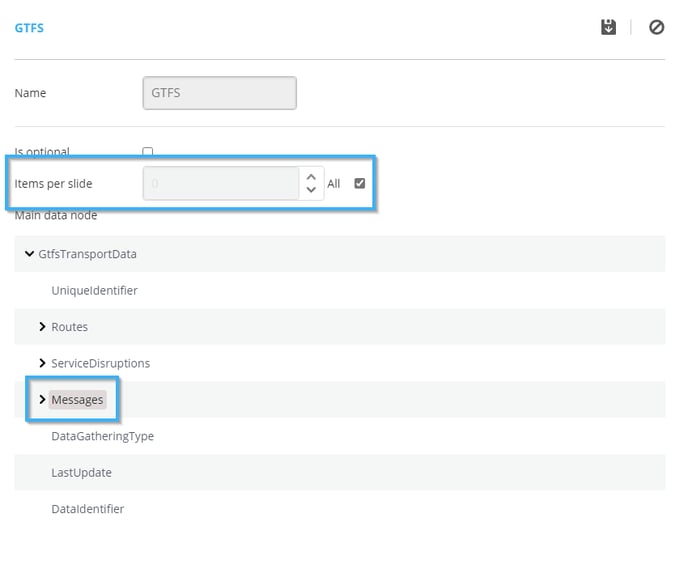
- Once you have saved the data source, it will be displayed on the left-hand side of the window, you can now close the window by clicking on the X in the top right-hand corner of the window
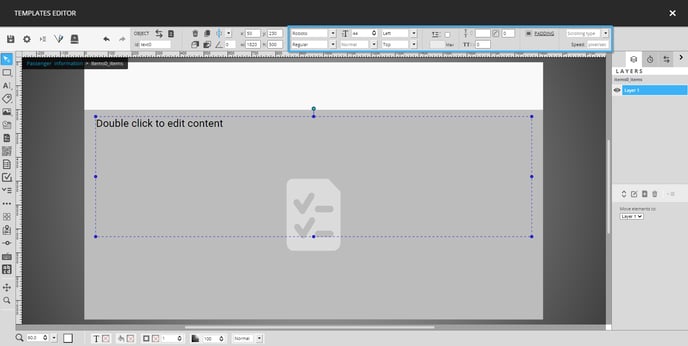
5. Visual element creation
- Add a background
- Click on the shape tool in the top left corner of the template editor
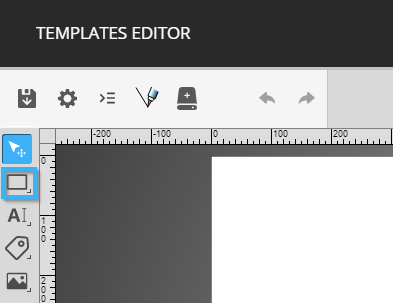
- You must click and drag your mouse in the blank space in the template editor to place the shape.
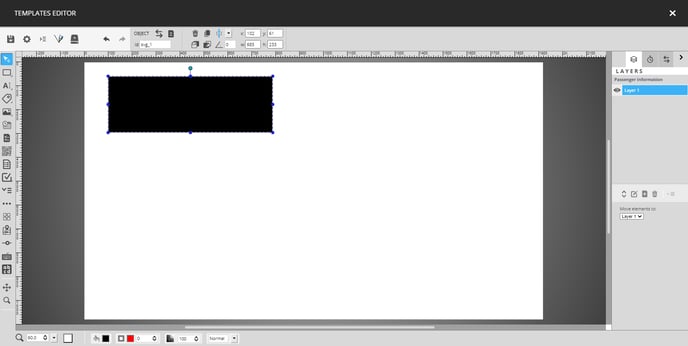
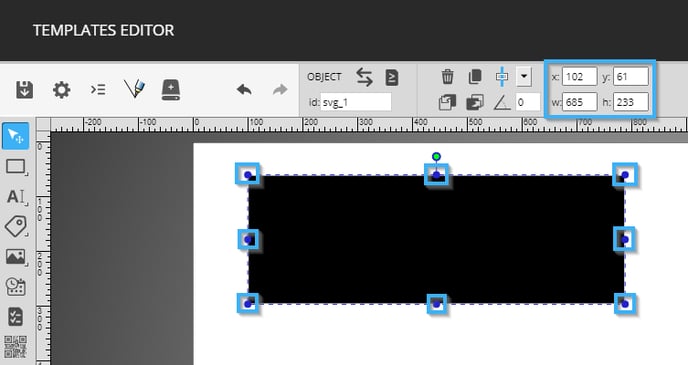
- You must resize the shape using the circles around the shape or numerically with the controls for the position and the size of the shape
- Once the shape has been placed, we will rename the layer to identify it. To rename the layer, click on the desired layer in the list on the right-hand side of the editor, then click the icon that represents a pencil under the list.
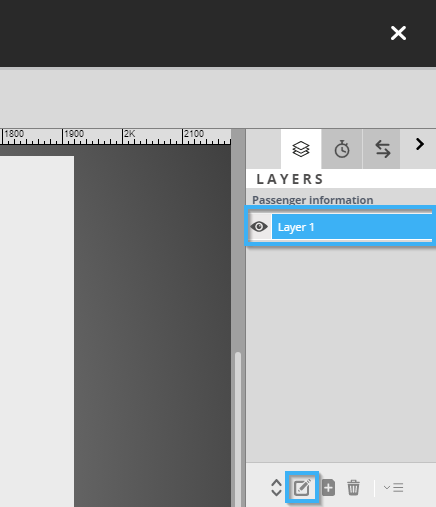
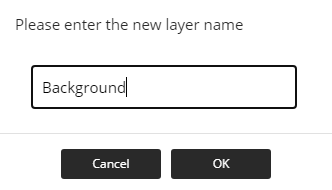
- In the window that opens enter the name, you wish to give the layer and click on the "OK" button
- Click on the shape tool in the top left corner of the template editor
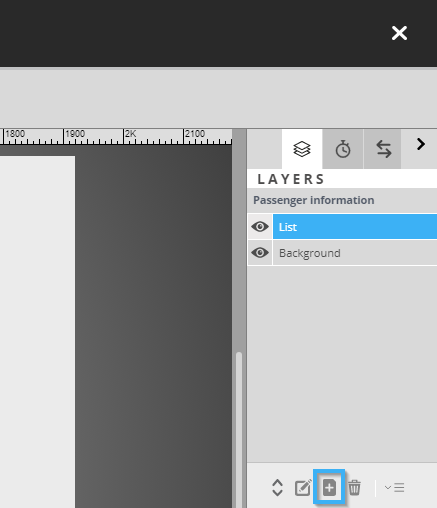
- Add the list
- Add a new layer and name it to identify it
- Click on the list tool on the left-hand side of the template editor
- Place the list the same way you placed the shape earlier
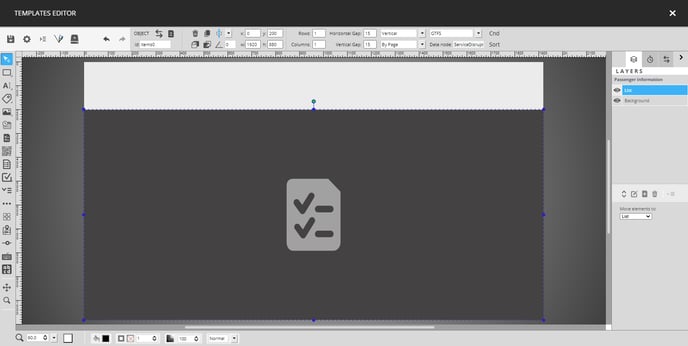
- In addition to the usual configurations in regard to the size and position of the list, you will need to specify the data source as well as the main data node used by the list. You must also specify the number of rows and columns that will be displayed in the list.
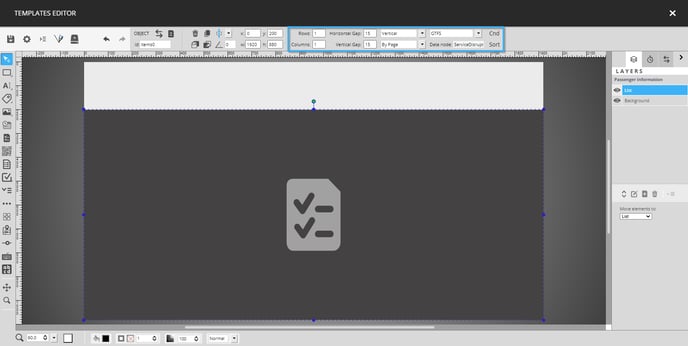
In the above example, the following configurations were used.
- Rows : 1
- Columns : 1
- Scrolling : Vertical
- Scrolling type : By page
- Data source : GTFS
- Main data node : Messages
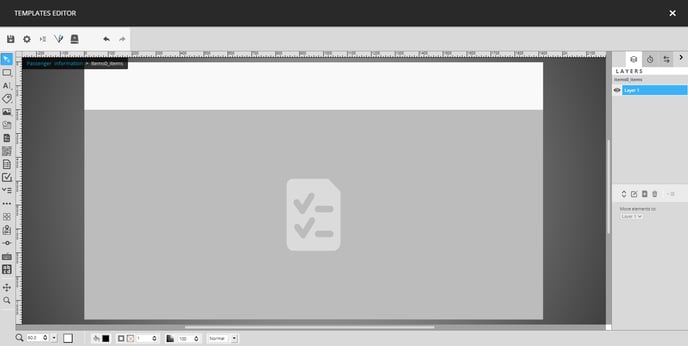
- You must now create visual elements inside the list, to do so you must double click it.
- Once you are inside the list's configuration, you will notice that you have a new list of layers and that the rest of the template has been greyed out. When you create items in the list (using shapes, texts, etc.) you only need to edit the first line of the list, it will automatically reproduce the visual on the following lines. In this example, there will only be one row, that being said, you can include several rows at a time if you prefer.
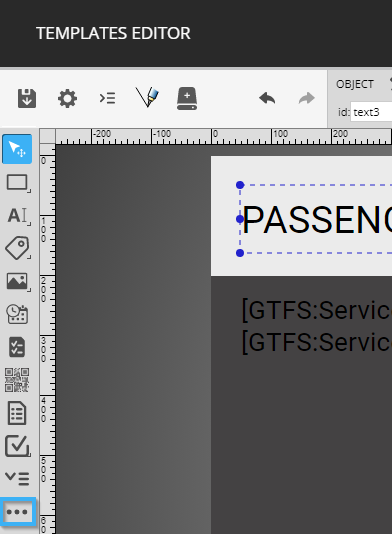
- Click on the text tool on the left-hand side of the template editor
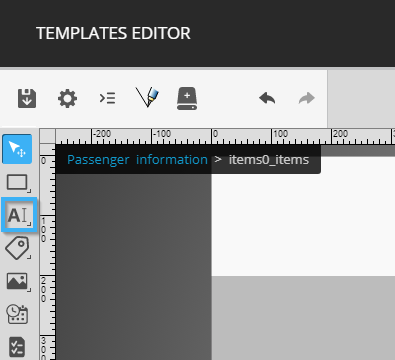
- Place the text tool the same way you placed the shape and list tools earlier. Once the tool is positioned, you can also edit the font configurations using the controls to the right of the tool's position and size.
- To edit the text inside the tool, you need to double click it once you have completed applying the font configurations. In the text configuration window click on the external data button.
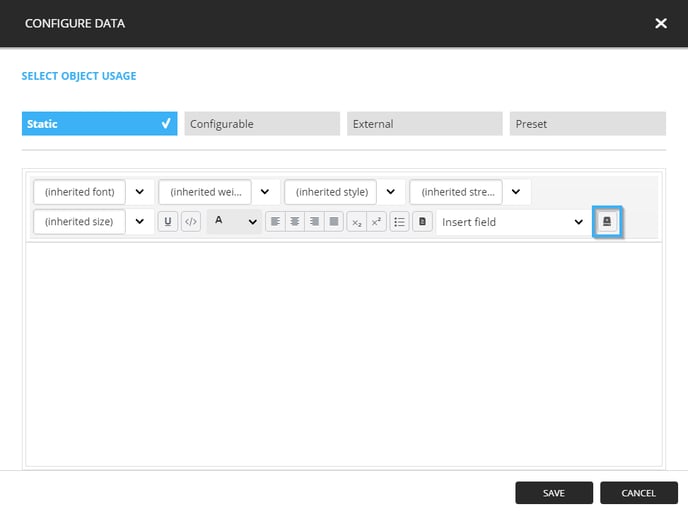
- Use the drop-down list in the top left-hand coroner of the window to select the data source.
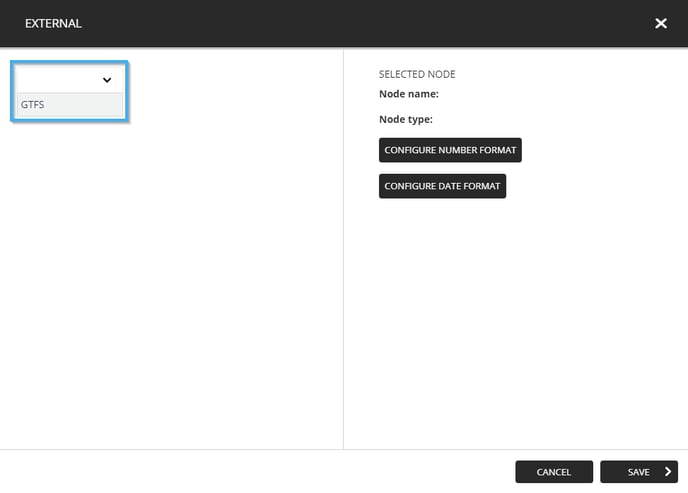
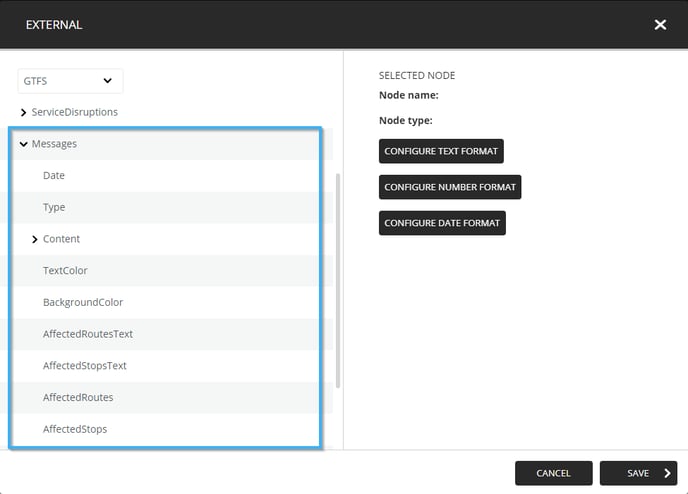
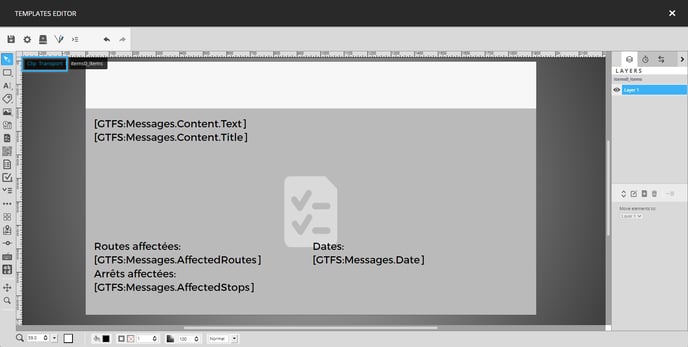
- Navigate the data source to view the information under the main data node (ServiceDisruptions in this case). The following are fields that will be used for this example.
- TransportData -> Messages -> AffectedRoutes (affected route number)
- TransportData -> Messages -> AffectedStops (affected stop number)
- TransportData -> Messages -> Content -> Title
- TransportData -> Messages -> Content -> Text
- TransportData -> Messages -> Date
- Add a new layer and name it to identify it
-
- Add a text tool for each of the fields you wish to broadcast in the list and click on the button that bares the template's name to return to its root
- Add a text tool for each of the fields you wish to broadcast in the list and click on the button that bares the template's name to return to its root
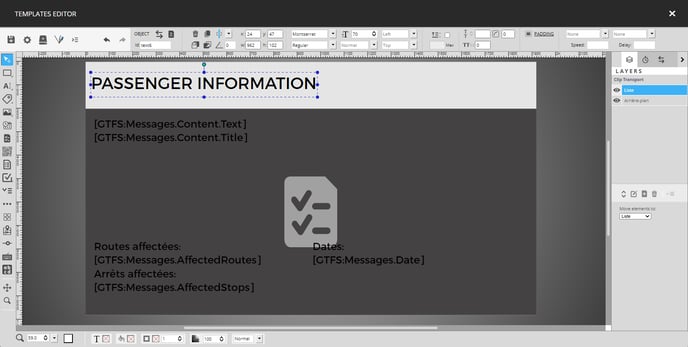
- Create a header
- It is possible to include a header as well as an indicator for the progress in the messages being broadcast. First place a text tool that will serve a title for the header.
- Next, click the multipage indicator in the list on the left-hand side of the template editor
- Place the tool the same way that you did with the others
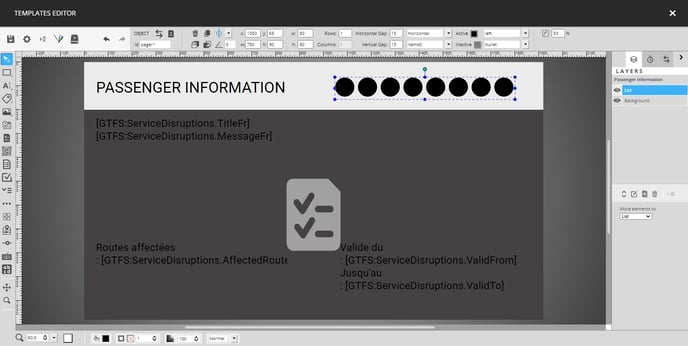
- You can use the controls for the style of the points on the right of the position and size configurations for the tool. The following are the values used in this example.
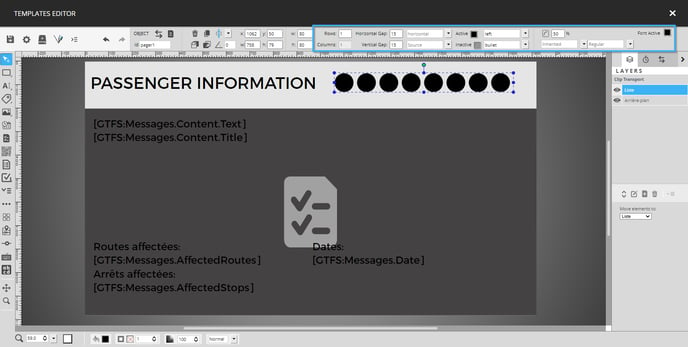
- Width : 80
- Hight : 80
- Element direction : Horizontal
- List (the data liste created in the template editor) : items0
- Active (Colour for the active point) : #000000
- Inactive (Colour for the inactive points) : #7f7f7f
- Horizontal alignment : Left
- Point type : Bullet
- It is possible to include a header as well as an indicator for the progress in the messages being broadcast. First place a text tool that will serve a title for the header.
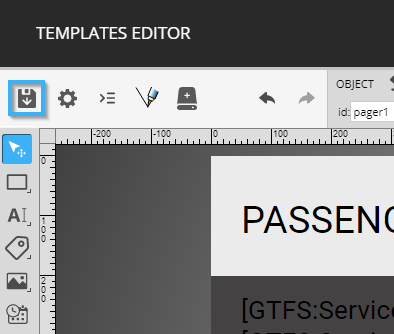
- Save the template
Once you have applied all of the required configurations, you can save the template by using icon that represents a floppy disk. Once it has been saved, the template will be available to broadcast on your signage network.