| available with: |
| Windows Player : Starter, Pro, Premium Web Player : Starter, Pro, Premium LG webOS Signage Player : Starter, Pro, Premium Samsung SMART Signage Platform (SSSP / Tizen) Player : Starter, Pro, Premium Brightsign Player: Starter, Pro, Premium Android Player: Starter, Pro, Premium Linux Player: Starter, Pro, Premium macOS Player: Starter, Pro, Premium |
Once connected to the ITESLIVE Studio, look at the space to the right of the gear icon in the top right corner of the Studio.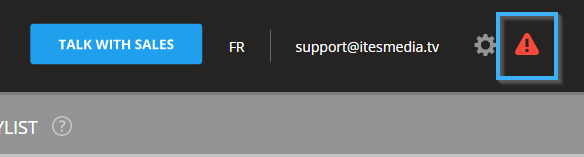
One of the following three icons will be displayed there.
 : There are no active alerts according to the alerts you chose to receive.
 : There are non critical active alerts according to the alerts you chose to receive.
 : There are critical active alerts according to the alerts you chose to receive.
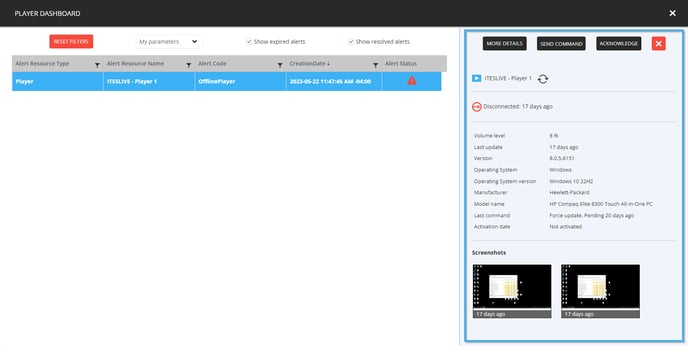
Clicking on the icon at this location will open the alert dashboard. The dashboard will contain all active alerts for signage network on the left-hand side of the window.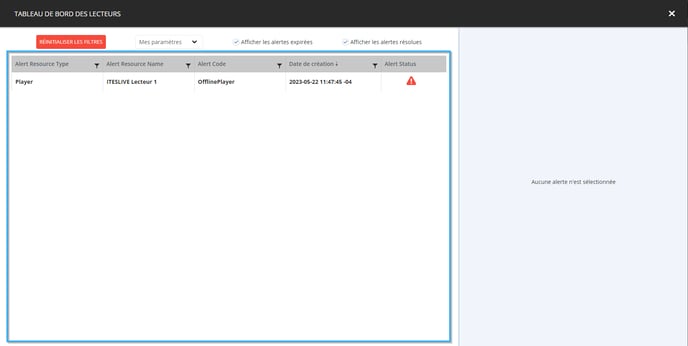
The following are the details available for each alert.
- Alert resource type: Indicates the type of resource affected by the alert.
- Alert resource name: Indicates the name of the resource affected by the alert.
- Alert code : Indicates the type of alert affecting the identified resource.
- Creation date : The alert's creation date.
- Alert status : Indicates the alert level.
- : Alert resolved
- : Non critical alert
- : Critical alert
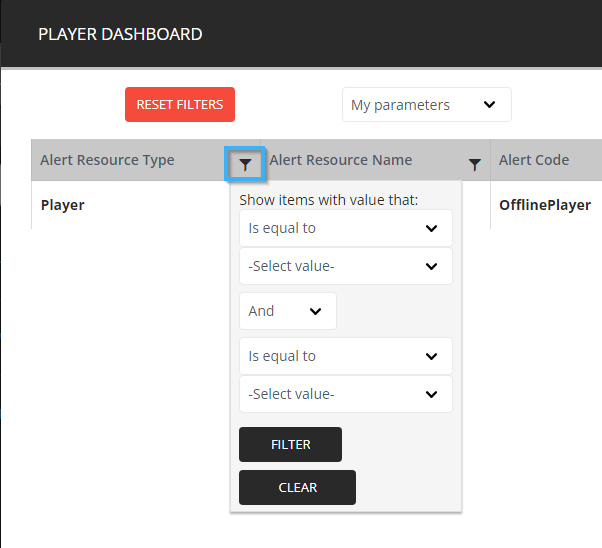
You can apply filters to each column in the dashboard by clicking on the funnel icon.
- Alert resource type : You can filter the alerts according to the type of resource that is affected.
- None
- Player
- AccontGroup
- TransportDataProvider
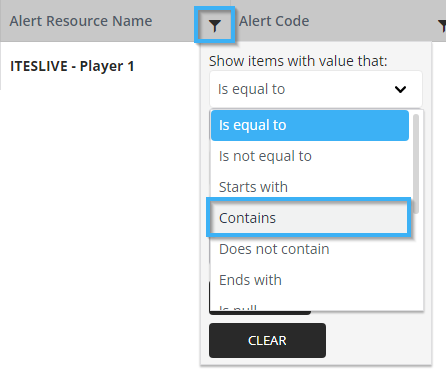
- Alert Resource Name : You can use this filter to target results according to a specific value.
- It is recommended that you change the filter type from "is equal to" to "contains" to avoid losing results should you only have a portion of the resource's name.
- It is recommended that you change the filter type from "is equal to" to "contains" to avoid losing results should you only have a portion of the resource's name.
- Alert code : You can filter the alerts in the dashboard by alert type.
- FreeMemory : Indicates that the RAM usage is too high on the identified resource.
- FreeHardisk : Indicates that there is little available space remaining on the identified resource.
- DisplayFrozen : The display has had exactly the same content for the last several screenshots and may be frozen on site.
- AppNotVisible : The display is currently being hidden by another window on the identified resource.
- DataProviderFallBack : The real-time data for the transport data provider for the identified resource are not available.
- OudatedOS : The identified resource's operating system is obsolete.
- OsUpdateRequired : The identified resource's operating system has a pending update.
- CpuTemp : The identified resource's processor's temperature is too high.
- DisplaySensors : An alert has been triggered by the identified resource's display sensor or the ITESLIVE software is no longer able to communicate with the display sensor.
- CpuLoad : The identified resource's processor load is too high.
- FailedContentUpdates : The identified resource has failed a content update.
- FailedDisplayStart : The identified resource's display has failed to start.
- IClientFailedToStart : The ITESLIVE software has failed to start on the identified resource.
- UnstableSignalConnection : The identified resource has been frequently losing ites connection with the ITESLIVE services.
- RenderProcessCrash : The process that renders the display's visual elements has stoppped working.
- ExternalDataDownloadFailed : The identified resource has failed to download the data for one of its external data clips.
- DisplayCountMismatch : The identified resource has detected fewer monitors than expected.
- WebClipFailedToOpen : The identified resource has failed to open the web page configured in a web page clip.
- ExpiredAccount : The identified resource's account group has expired.
- TransportDataProviderNoData : There is no data for this transport data provider.
- TransportDataProviderNearExpiration : This transport data provider's data is nearing its expiration date.
- TransportDataProviderExpired : This transport data provider's data has expired.
- TransportDataProviderDataImportError : An error has occurred during the data importation process for this transport data provider.
-
- BandwidthUsage : The identified resource's bandwith usage is too high.
- Player offline : Indicates that the identified display device has lost its connection to the ITESLIVE services.
- Office 365 error : An error occured when the display attempted to open an Office 365 document.
- Facebook error : An error occurred when the display attempted to recover the Facebook account's data.
- Time difference : The current time on the display device is not correct according to its time zone.
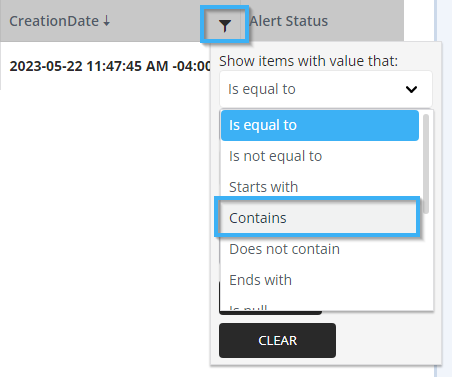
- Creation date :
- You can use this filter to target results according to a specific value.
- It is recommended that you change the filter type from "is equal to" to "contains" to avoid losing results should you only have a portion of the alert's creation date.
- It is recommended that you change the filter type from "is equal to" to "contains" to avoid losing results should you only have a portion of the alert's creation date.
If you wish to view all of the alerts once more, after having applied filters to the dashboard, click the "reset filters" button to reset the dashboard. 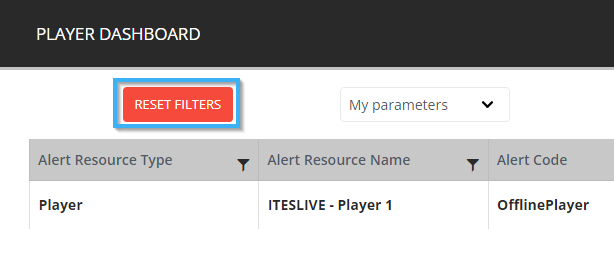
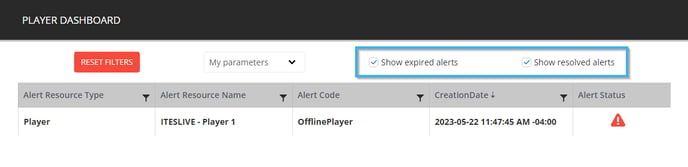
You can also enable or disable the expired and resolved alerts by using the "Show expired alerts" and "Show resolved alerts" checkboxes.
Finally, to view more information about the resource affected by the alert, you can click on the alert in the list and the resource's information will be displayed in the right-hand side of the dashboard.