How to view my reports on the ITESLIVE Studio
Learn how to view your reports on the ITESLIVE Studio
| available with: |
| Windows player: Starter, Pro, Premium Web player: Starter, Pro, Premium LG webOS Signage Player: Starter, Pro, Premium Samsung SMART Signage Platform (SSSP / Tizen) Player: Starter, Pro, Premium BrightSign Player: Starter, Pro, Premium Android Player: Starter, Pro, Premium |
Note: Reports in the ITESLIVE software are produced according to custom requests for our clients according to the information you wish to see.
Once you have logged in to your account in the ITESLIVE Studio, you will see a list of tabs in the top left corner of the window to the right of the ITESLIVE logo.

Click the configuration tab and select reports.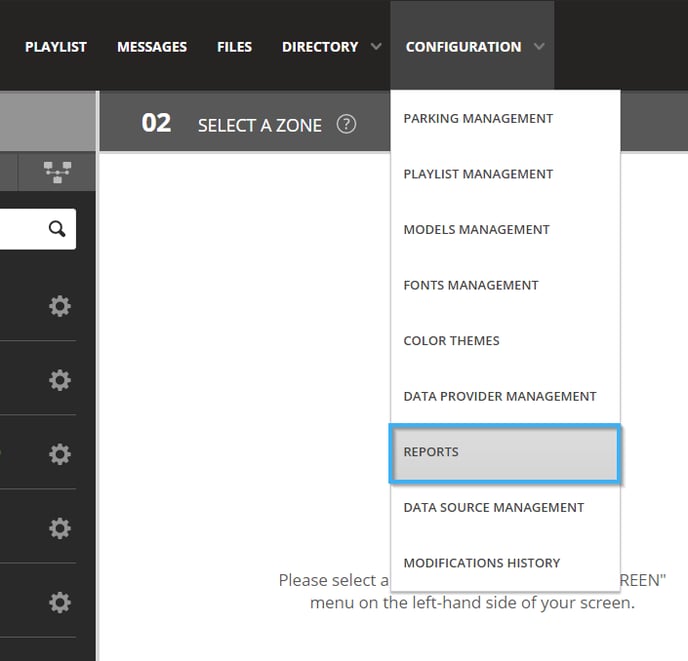
Click the report you wish to view and click the launch report button.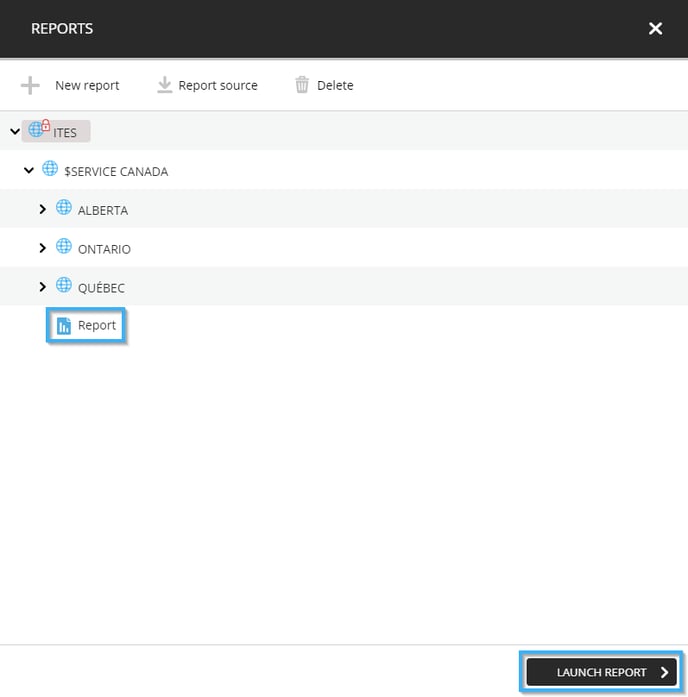
When the report is launched, in some reports data will already be displayed and for others you may first need to select the time frame from which we will pull data.
Note: Seeing that these reports are custom, there is not necessarily a standard for the controls used to determine the time frame within which data is used or for the visual aspect of the report because these are created according to your specific needs.
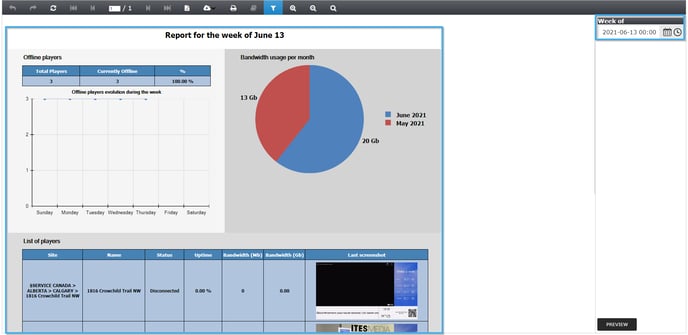
Once you have selected the time frame within which the data will be pulled or the week during which the data will be pulled, click the preview button.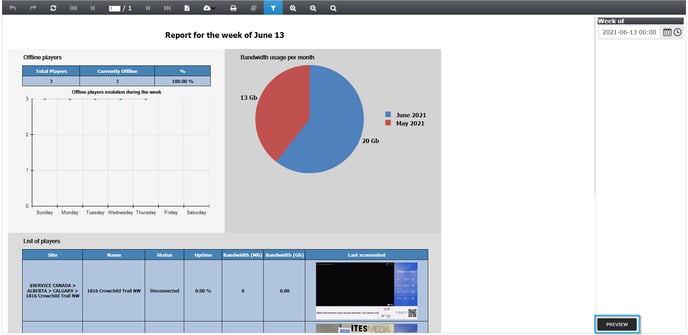
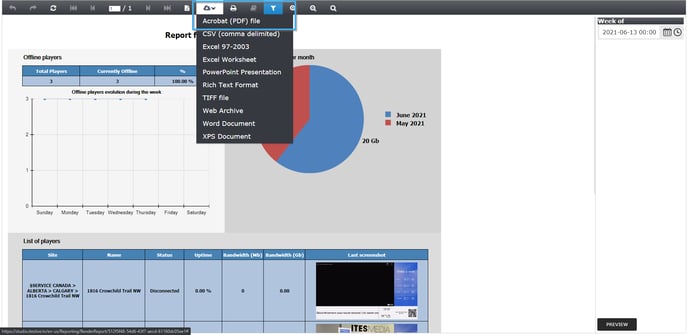
You can print the report, to do so you must click the icon representing a printer.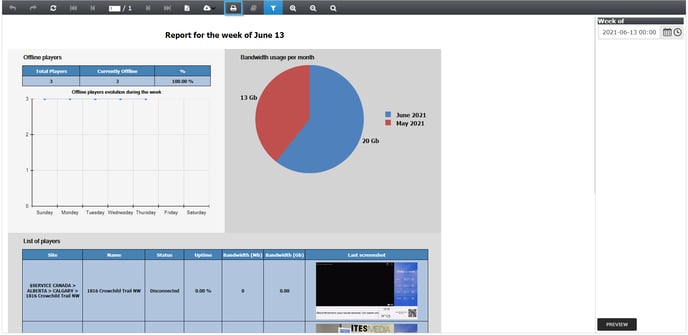
You can also download the report as a PDF file.