| available with: |
| Windows Player : Starter, Pro, Premium Web Player : Starter, Pro, Premium LG webOS Signage Player : Starter, Pro, Premium Samsung SMART Signage Platform (SSSP / Tizen) Player : Starter, Pro, Premium Brightsign Player: Starter, Pro, Premium Android Player: Starter, Pro, Premium Linux Player: Starter, Pro, Premium macOS Player: Starter, Pro, Premium |
Click on the account group or the site that contains the player whose alert history you wish to view.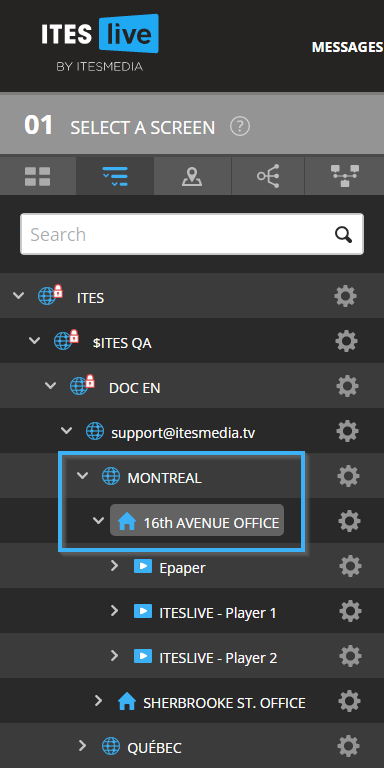
Click on the player in the table at the center of the ITESlive Studio.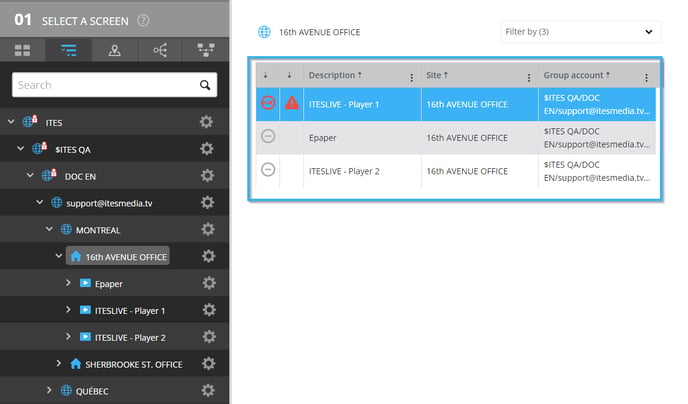
The player's information will be displayed on the right-hand side of the Studio. Click on the "Show player log history" text below the player's status.
The list of alerts for the selected player will be displayed on the left-hand side of the window.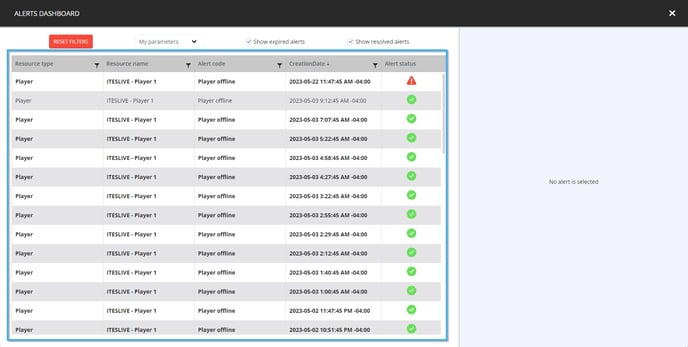
If you click on an alert in this location, the player's current information will be displayed on the right side of the window.
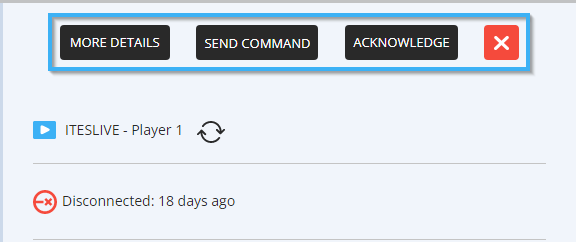
You can use the three buttons above the player's information to interact with it.
- More details : Opens the "More details" window for the selected player.
- Send command : Opens a window that allows you to send commands to the selected player.
- Acknowledge : Notes on the dashboard that a user has acknowledged this alert. When you click on the "Acknowledge" button, the alert will no longer appear on bold in your alert dashboard. This will also be visible to other users who view the selected player's log history.
When you are viewing the alert history, the alerts that are displayed in bold have not been acknowledged, the alerts that are not displayed in bold have been acknowledged. 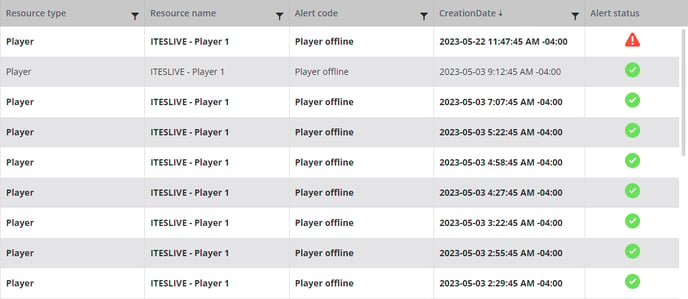
You can filter each column in the alert history by clicking on the funnel to the right of its header.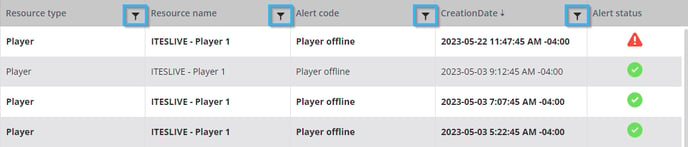
For the "Resource type" and "Alert code" columns, the filter will allow you to chose a value in a list.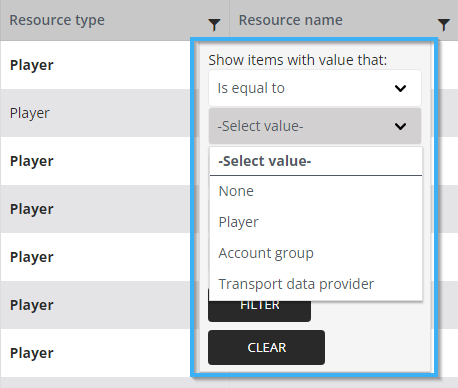
For the "Resource name" and "Creation date" columns, you can search for a specific value.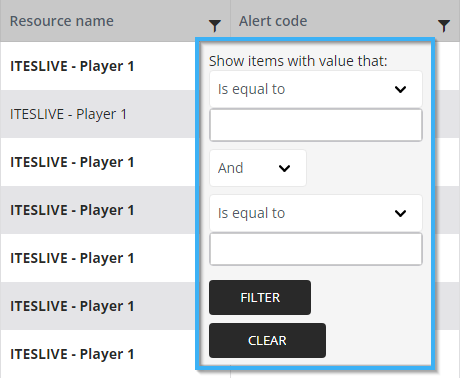
Each alert in the table an icon that represents its status, the following is what each icon indicated.
The red triangle that contains an exclamation mark indicates that the alert is critical.
The orange circle that contains an exclamation mark indicates that the alert is not yet critical.
The green circle that contains a check mark indicates that the alert has been resolved.
The grey circle that contains a vertical line and an x indicates that the alert has expired.